Creating and Running Pipelines
A new pipeline can be created from the Pipelines page from the menu. A pipeline will typically begin with a dataset. Click the ‘Add nodes’ button on the left, and drag a dataset node into the canvas to begin. The dataset can be set by changing the name field on the node. Dragging in an action node from the left will allow you to apply an operation to the dataset. Join the dataset to the action node by dragging the handle below the dataset node. The documentation below details how to use each action node. To save the pipeline, click the ‘Save’ button in the bottom right. To run the pipeline, click the ‘Run’ button in the bottom right.Pipeline AI Assistance
The TrueState AI Assistant is able to create and modify pipelines. This is the preferred way to get started with a pipeline. Describe what you want the pipeline to do, and the bot will create it for you. It can also be very useful as a debugging tool - if you provide the error in the chat it will make the required modifications to the pipeline to resolve it. A pipeline must be added to the chat context for the bot to be able to modify it. Click the + icon above the chat and select the pipeline to add it to the context.Dataset Nodes
Model Nodes
A model node stores the model created by a training step. This model can then be utilised by an inference step. The model node is plug-and-play: there is no code required to use the models.Action Nodes
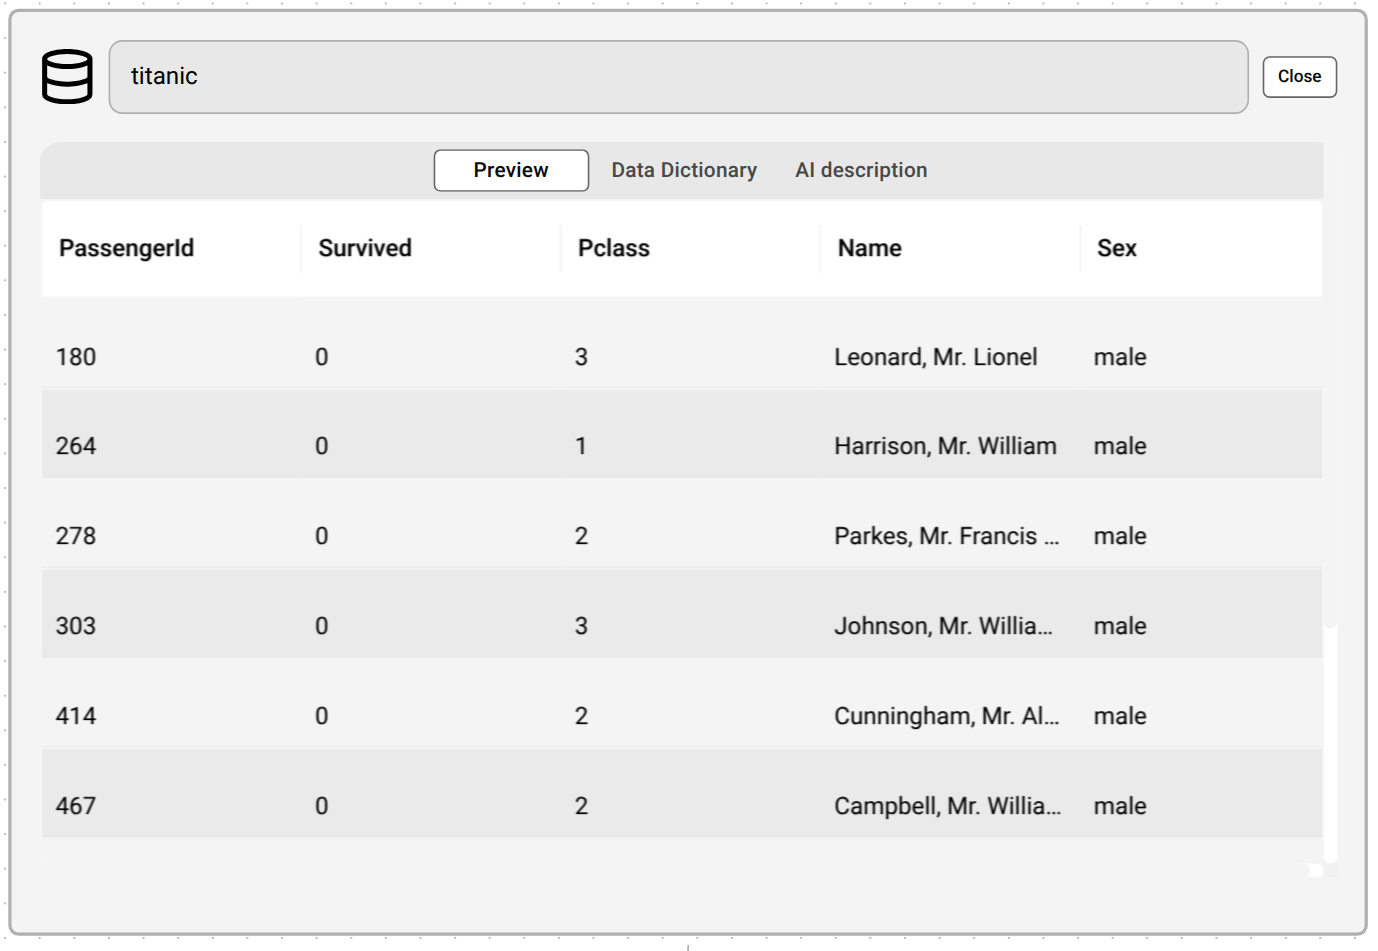
An Action Node represents an operation that is performed on some data, producing either a new dataset, or a trained model.Integration (Import)
Refer to the Loading Data guide: Importing from external platforms.Data Transforms
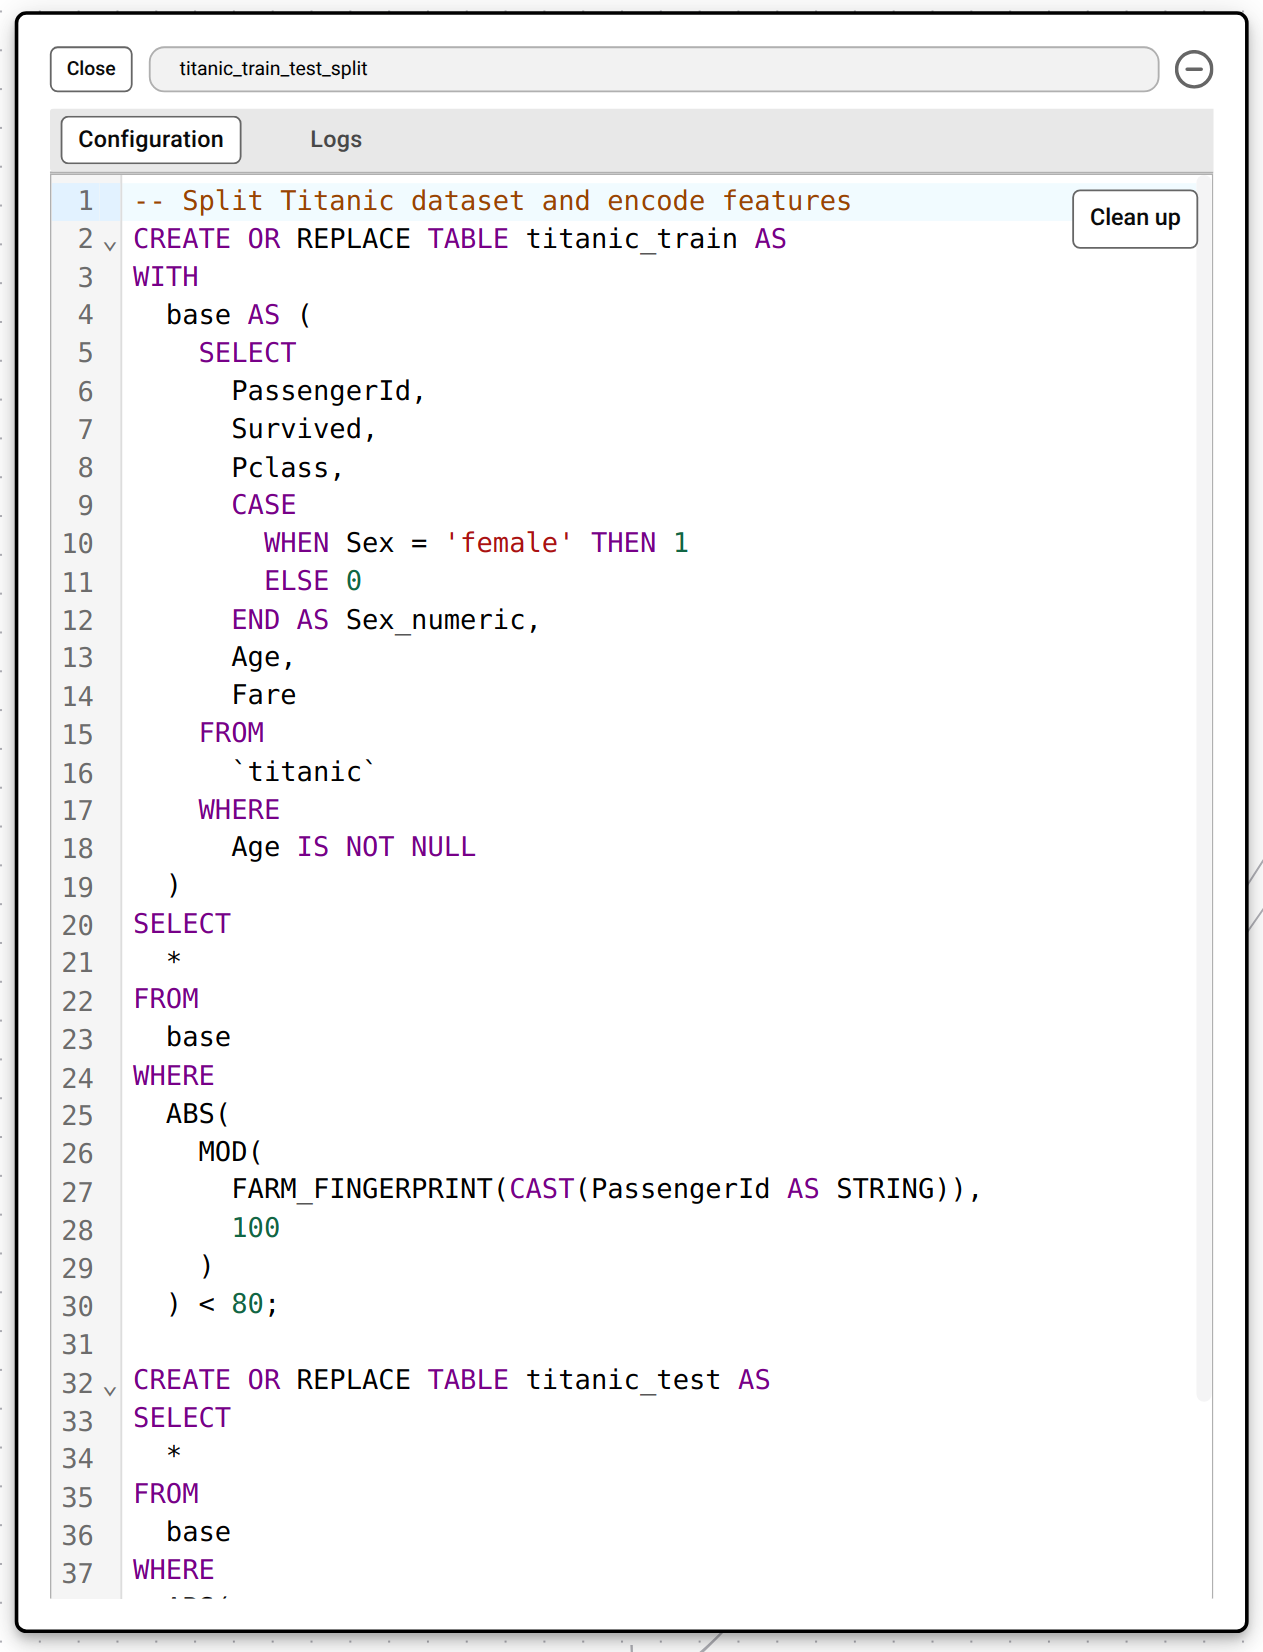
CREATE OR REPLACE TABLE statement prefaced with a simple comment explaining the logic, and specify the names of the outputs. When the pipeline runs, each transform step executes in order on BigQuery, producing clean, versioned datasets that downstream steps—like model training, embeddings or exports—can reliably consume.
If you are not comfortable writing SQL syntax, the TrueState AI assistant can be used to write these queries. Providing the bot with a text description of what the transformation should do will allow it to write the SQL code for you.
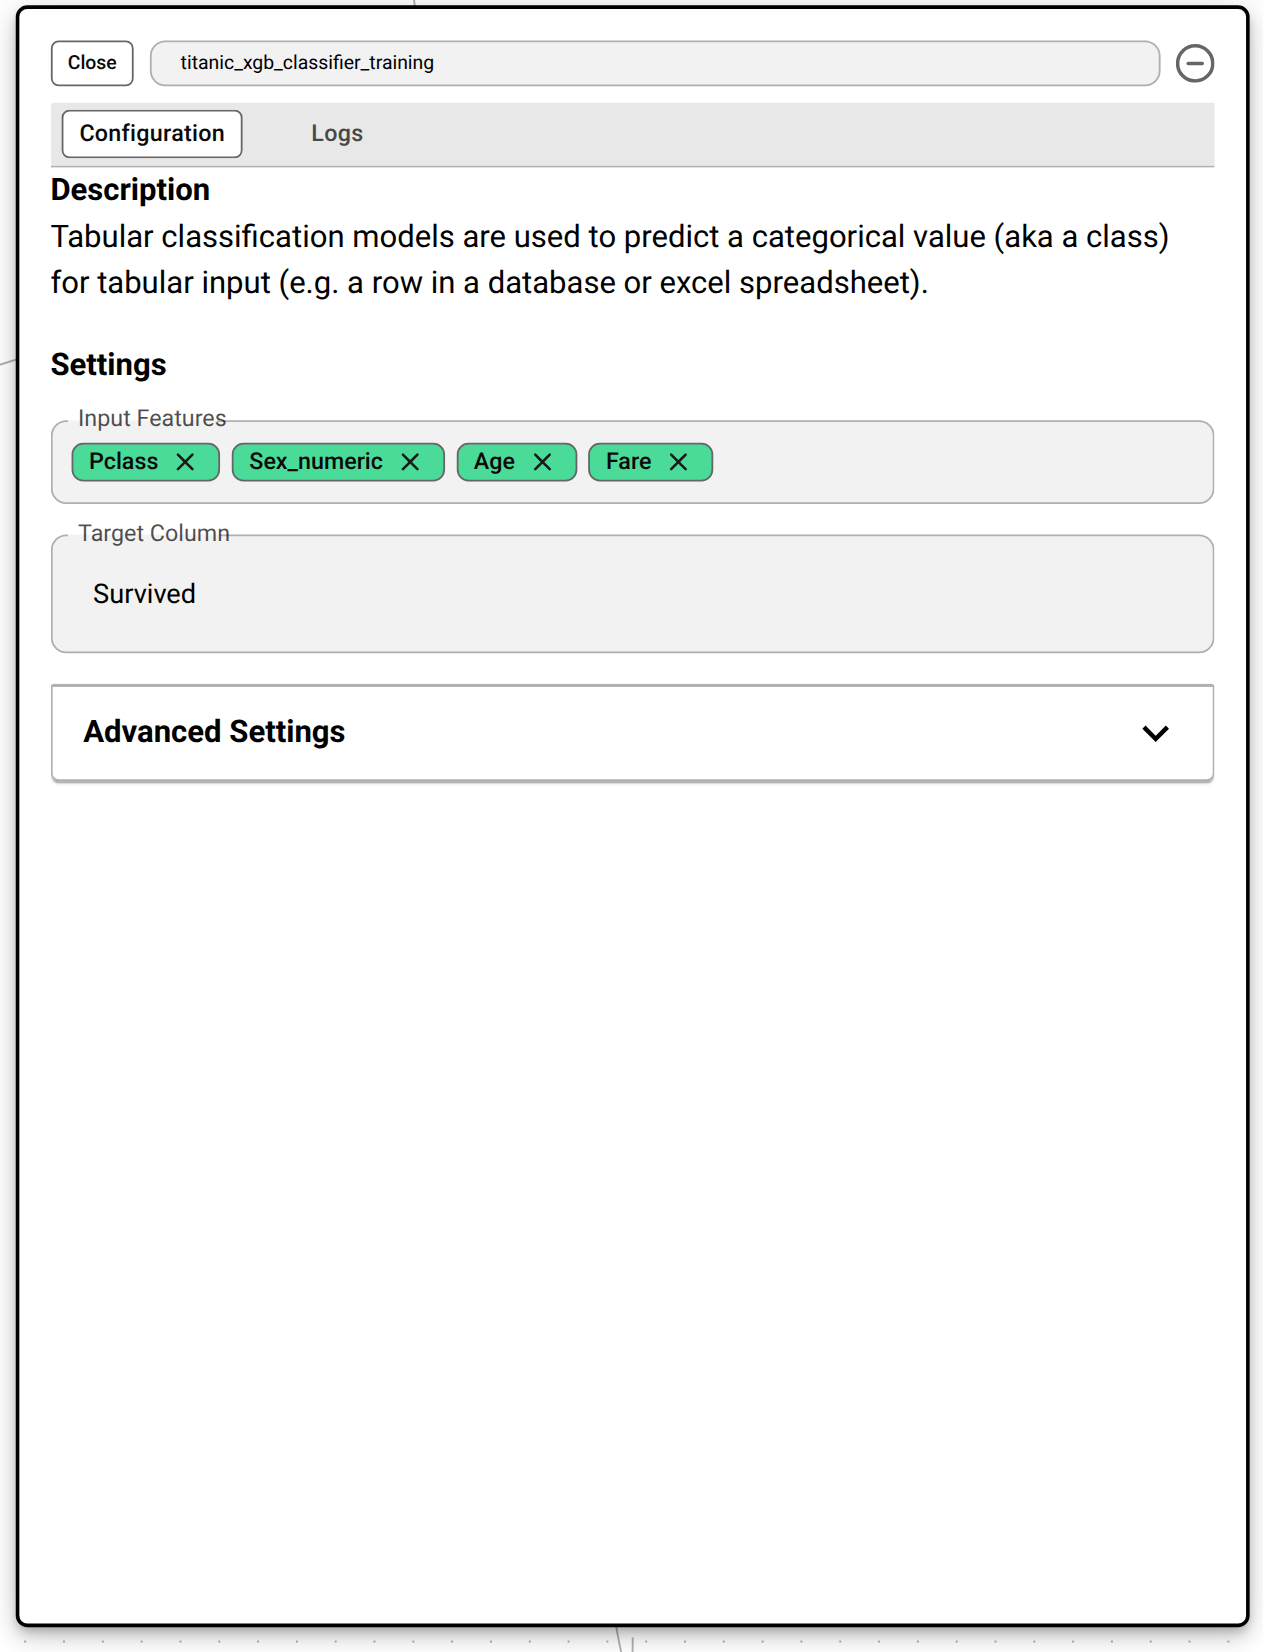
Regression and Classification Model Training
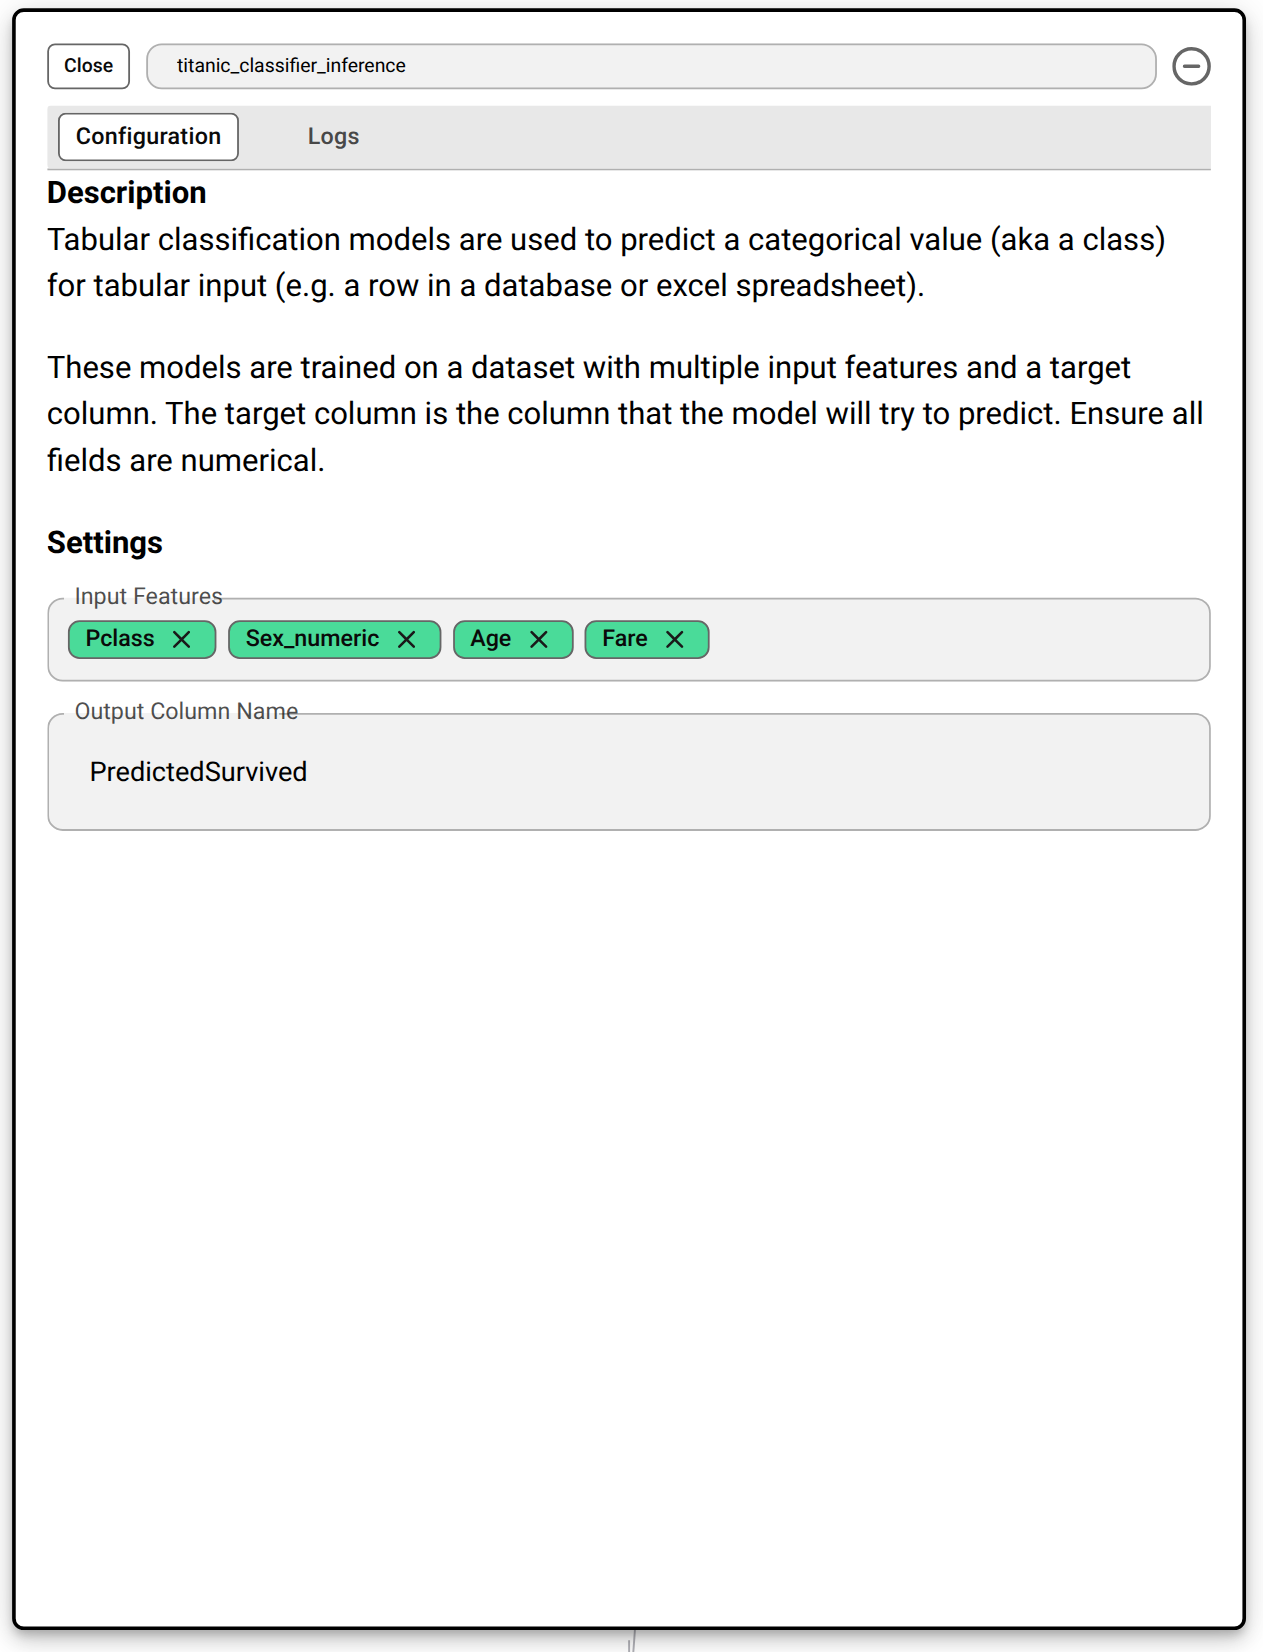
Regression and Classification Model Inference
LLM Inference
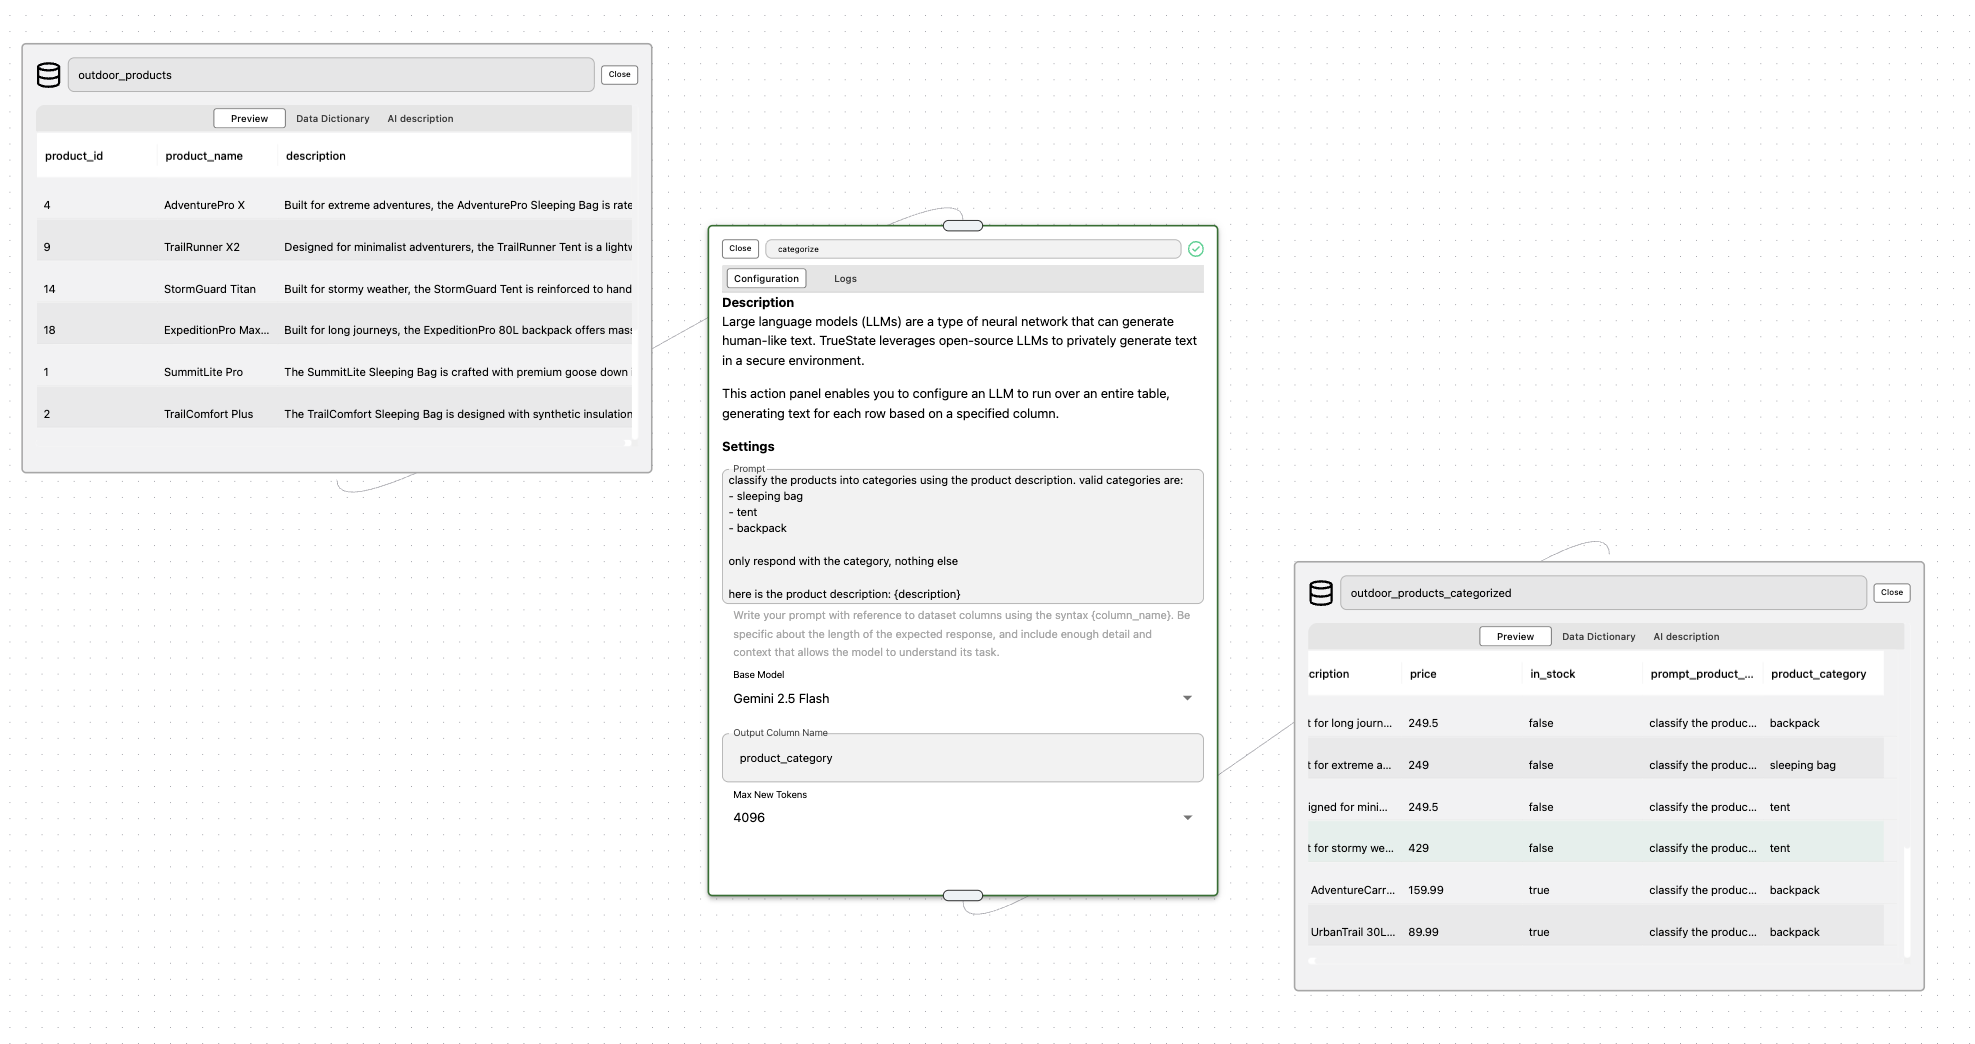
You can apply a LLM prompt to process each row in a dataset. The LLM model generates a response for every row, and the output is stored in the column you specify under Output Column Name. Use the syntax in your prompt to reference values from dataset columns. During the pipeline run, {column_name} will be replaced by the actual text from that column.Example: Categorizing Products
In the example below, we use LLM Inference to classify products into categories (sleeping bag, tent, backpack) based on their description column.| Parameter | Value |
|---|---|
| Input Dataset (outdoor_products) | Contains product details including product_id, product_name, and description. |
| LLM Configuration | The prompt instructs the model to classify each product into one of the valid categories using the product description. |
| Output Dataset (outdoor_products_categorized) | The results include a new column product_category, which stores the LLM’s classification for each product. |
Apply Embeddings
Embedding nodes let you transform unstructured text into numerical vectors so you can power semantic search, clustering or downstream machine-learning tasks. To use the node, you drag your source dataset onto the canvas, connect it to an “Apply Embeddings” node, and then specify the name of the text column to embed and a name for the new output dataset. When you run the pipeline, TrueState applies a pretrained embedding model to each row’s text, adds a new vector column to your output dataset, and tags it as embedding-searchable—making it easy to perform similarity queries or integrate with dashboards and automations without writing any custom embedding code.Running Pipelines
The ‘Run’ button in the bottom right of the canvas can be used to run all of the jobs in sequence. To run a specific subset of jobs, use the ‘Run Subset’ button in the header to select a start and finish job. To run a specific node, or all jobs below a specific node, use the run icons to the right of the node.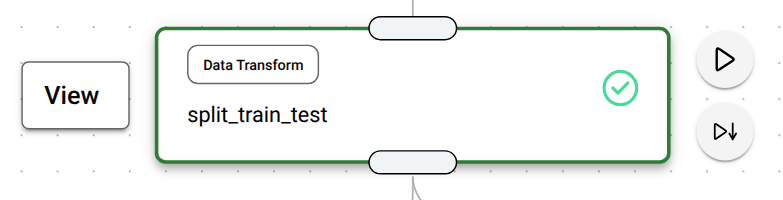
Logs
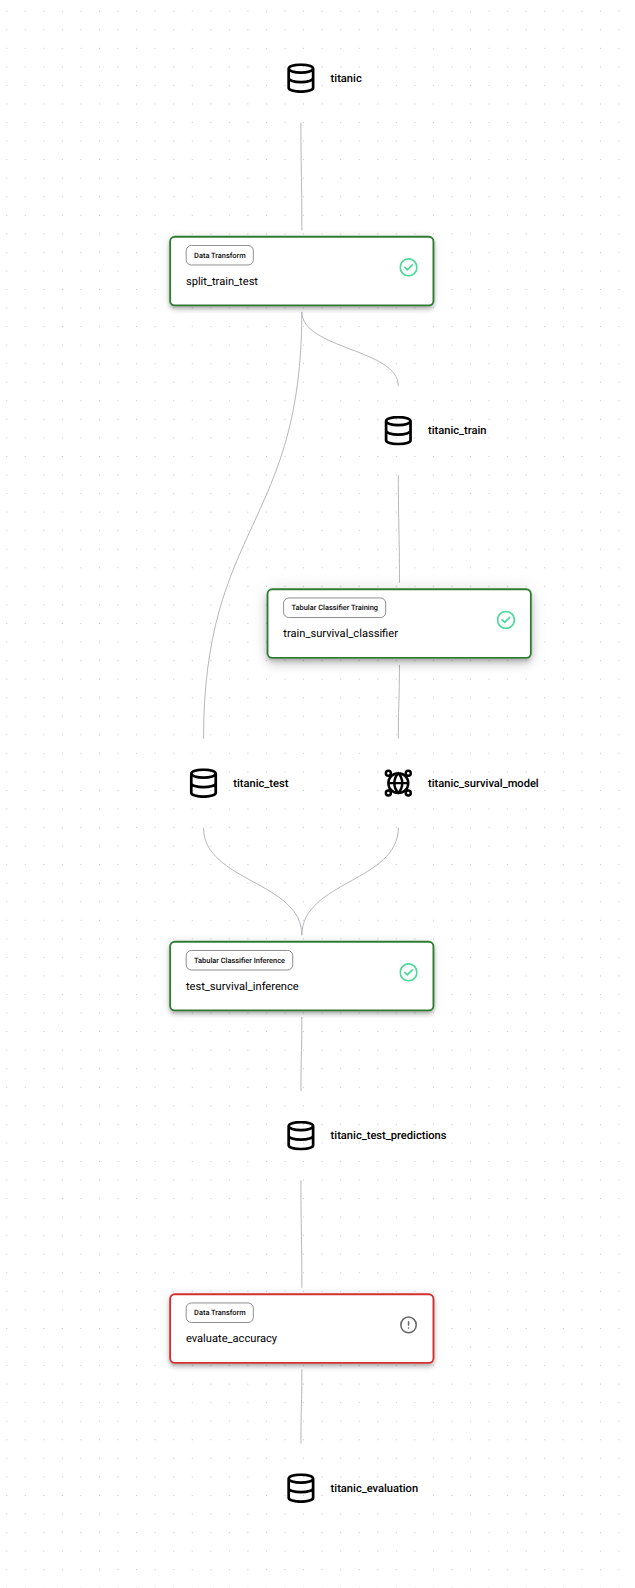
After you click ‘Run’, the pipeline will begin working on our dedicated infrastructure. As it works, updates will be posted back to the display as logs.Node States
| State | Meaning |
|---|---|
| Black | Will not run |
| Blue | Pending or Running |
| Green | Success |
| Red | Failed |
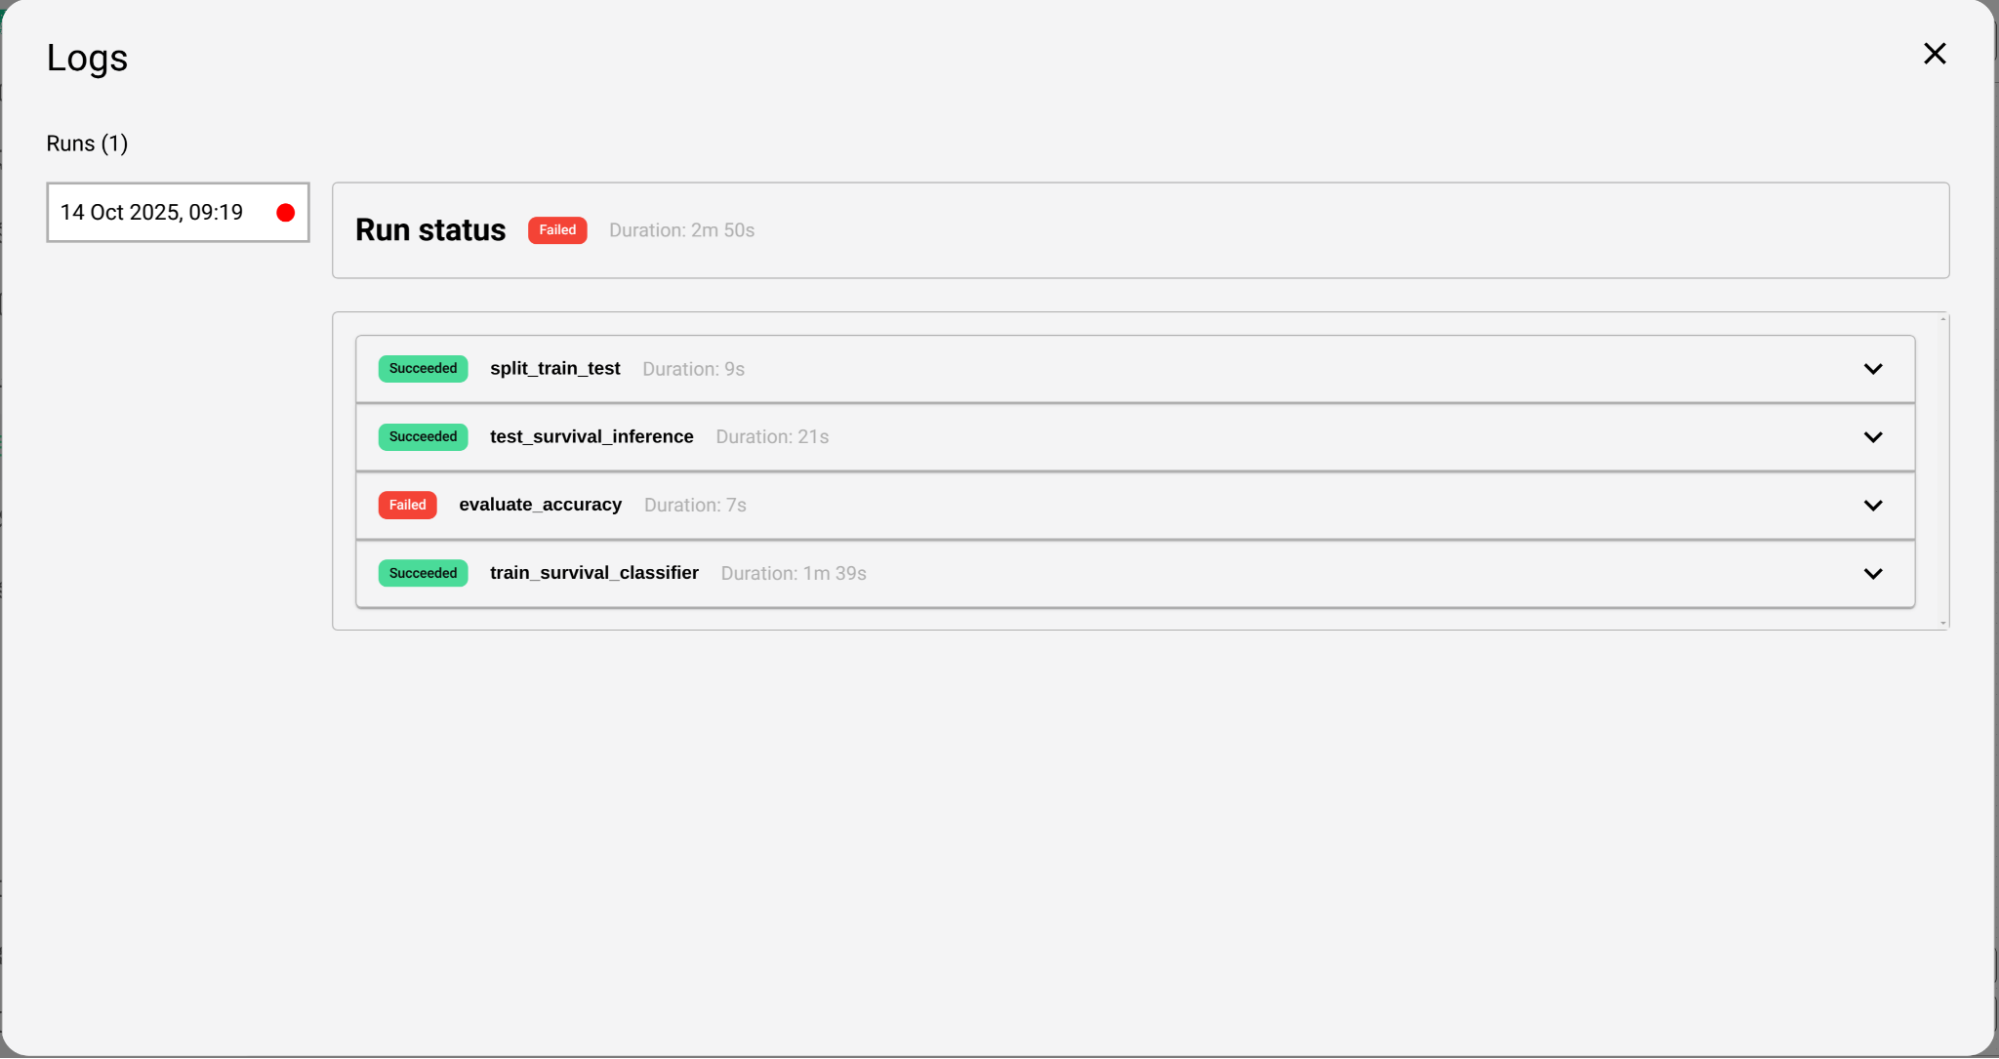
Viewing Logs
Debugging
Adding the error to the chat allows the TrueState AI Assistant to understand what has gone wrong in the pipeline execution. The assistant can then make any required inspections of the data using the query tool, and then resolve the error by modifying the Pipeline directly. Common debugging issues include:- Empty columns
- Incorrect column names
- SQL syntax and type issues
- BigQuery SQL dialect issues