Concepts and Definitions
| Term | Definition |
|---|---|
| TrueState AI Assistant | The chatbot that guides you through the platform and assists with analysing and understanding data. |
| Dataset | A single source of data representing many rows of a fixed column schema. Examples: one spreadsheet, one CSV file, or one SQL table. |
| Report | A long-form document used to capture analyses, insights and recommendations, that can be produced by a bot. |
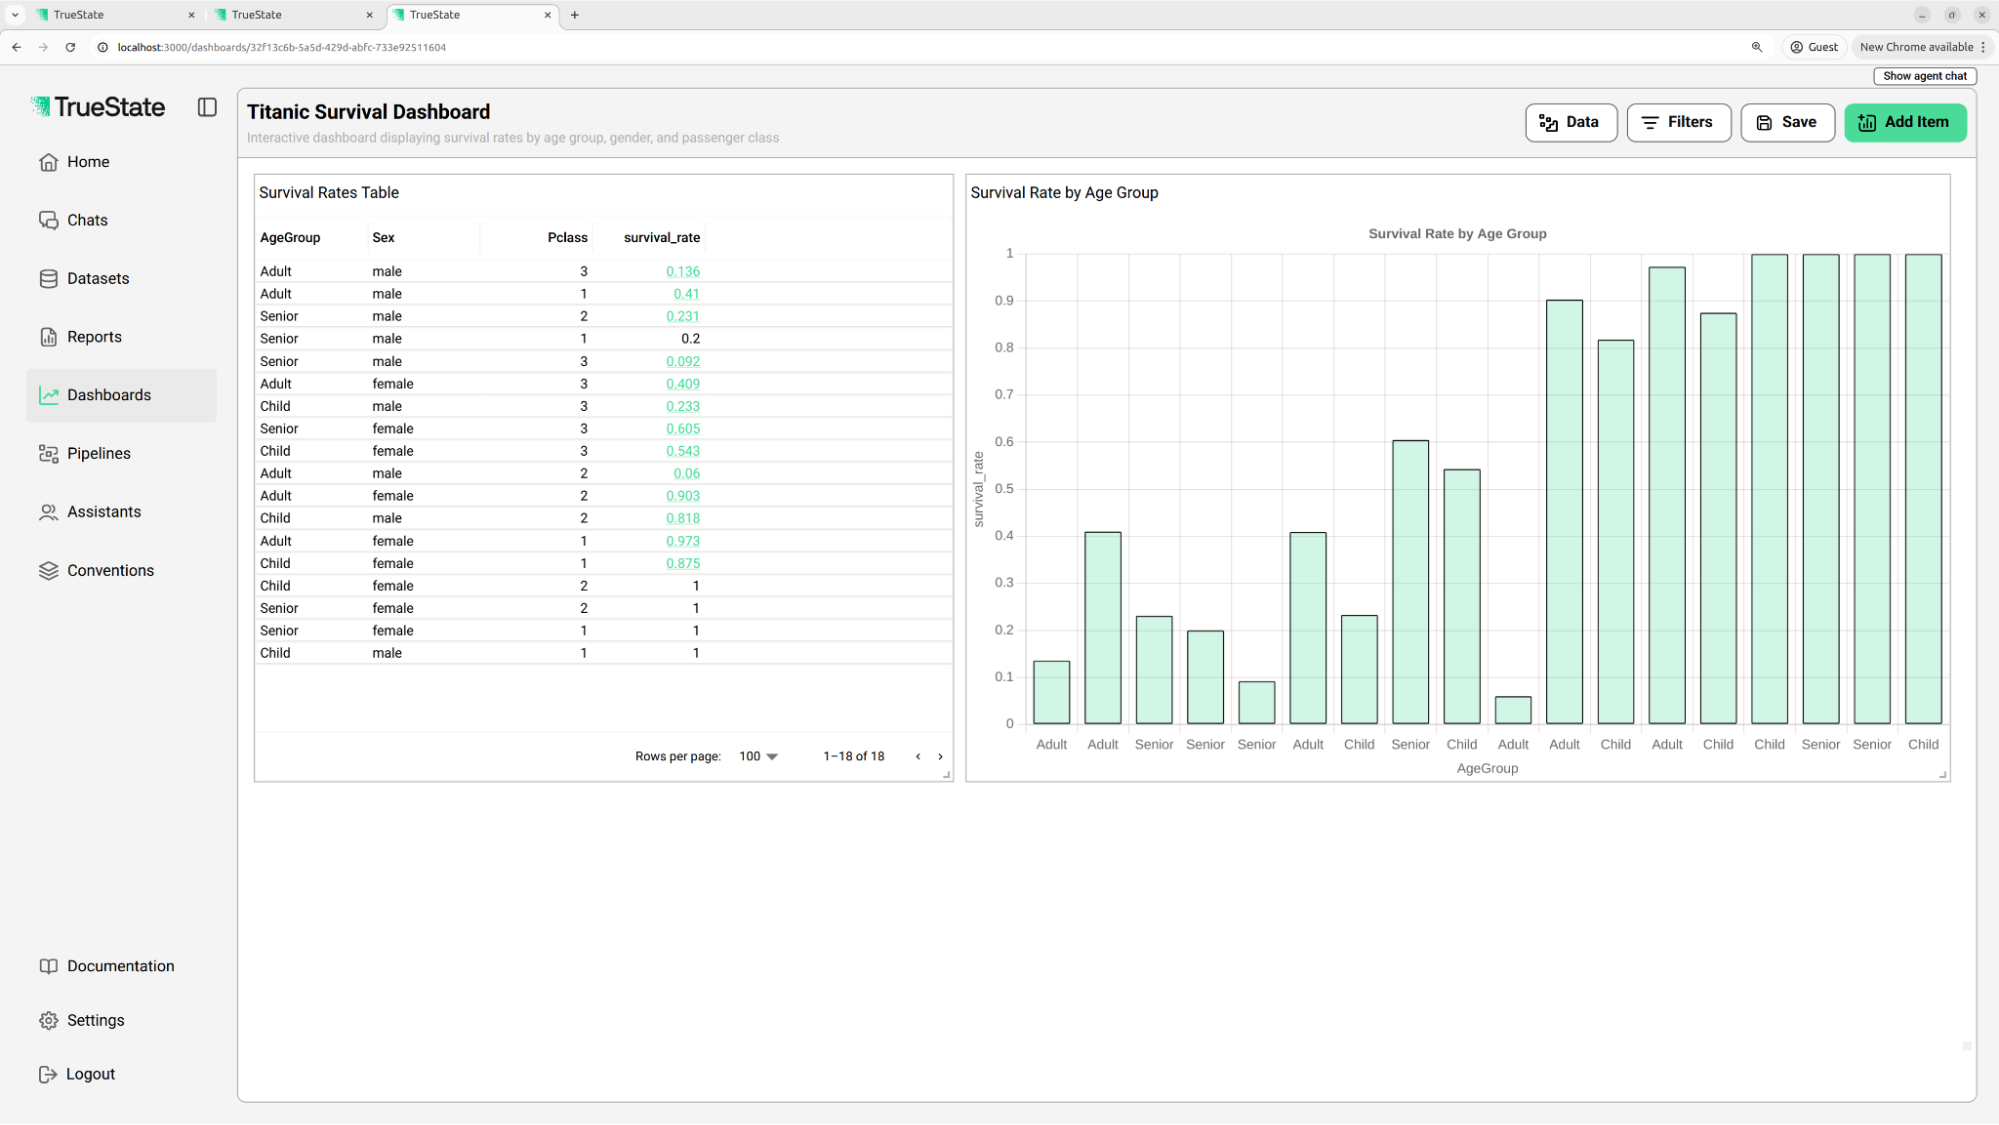
| Dashboard | An interactive page of visualisations and tables built from a data source, allowing users to explore, filter, and drill into their data in real time. |
| Pipeline | A recipe of ordered steps on the data (ingestion, cleaning, model training, model application). |
| Custom Assistants | Chatbots that accept custom instructions to perform specific tasks on your data. |
| Organisation | The shared workspace for users on a single team. |
Account setup
Create your account
Head over to the Platform and follow the prompts to create an account. You’ll be allocated US$10 worth of initial credits and your account will be pre-loaded with some sample data.
Invite your team
Once you’ve created your account, head to the Team page and invite your team. They’ll receive an email explaining how to get started.
Tutorial
The tutorial is driven by the AI chatbot. It guides you through an example use case involving the Titanic dataset (a classic machine-learning demo) and walks you through adding data to context, running queries, creating visualisations and dashboards, and building machine-learning pipelines.Start the tutorial
On first login, select ‘Meet your AI data analyst’. Alternatively, click ‘Start tutorial conversation’ from the home page.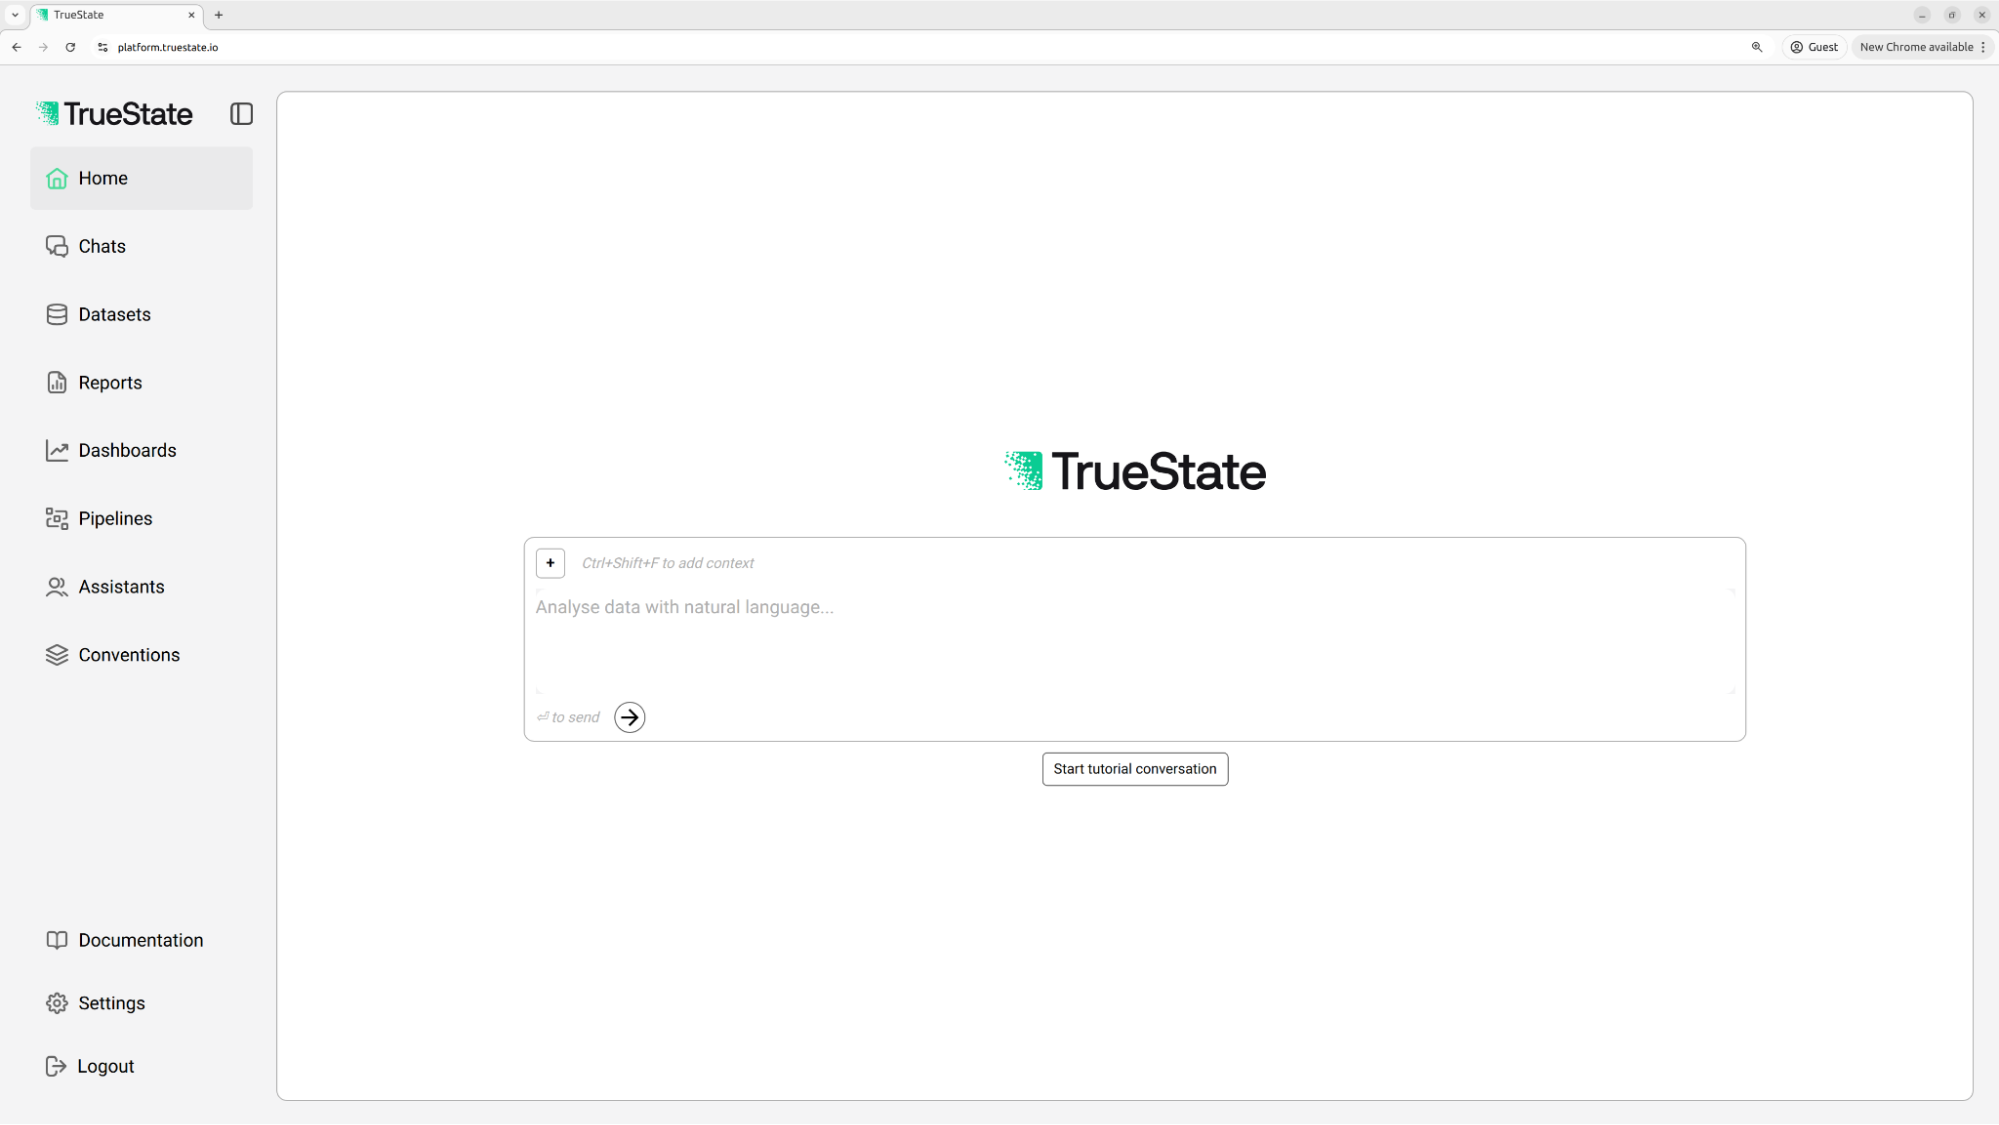
Add the Titanic dataset to context
Use the + icon above the chat box to add the Titanic dataset to the chat context.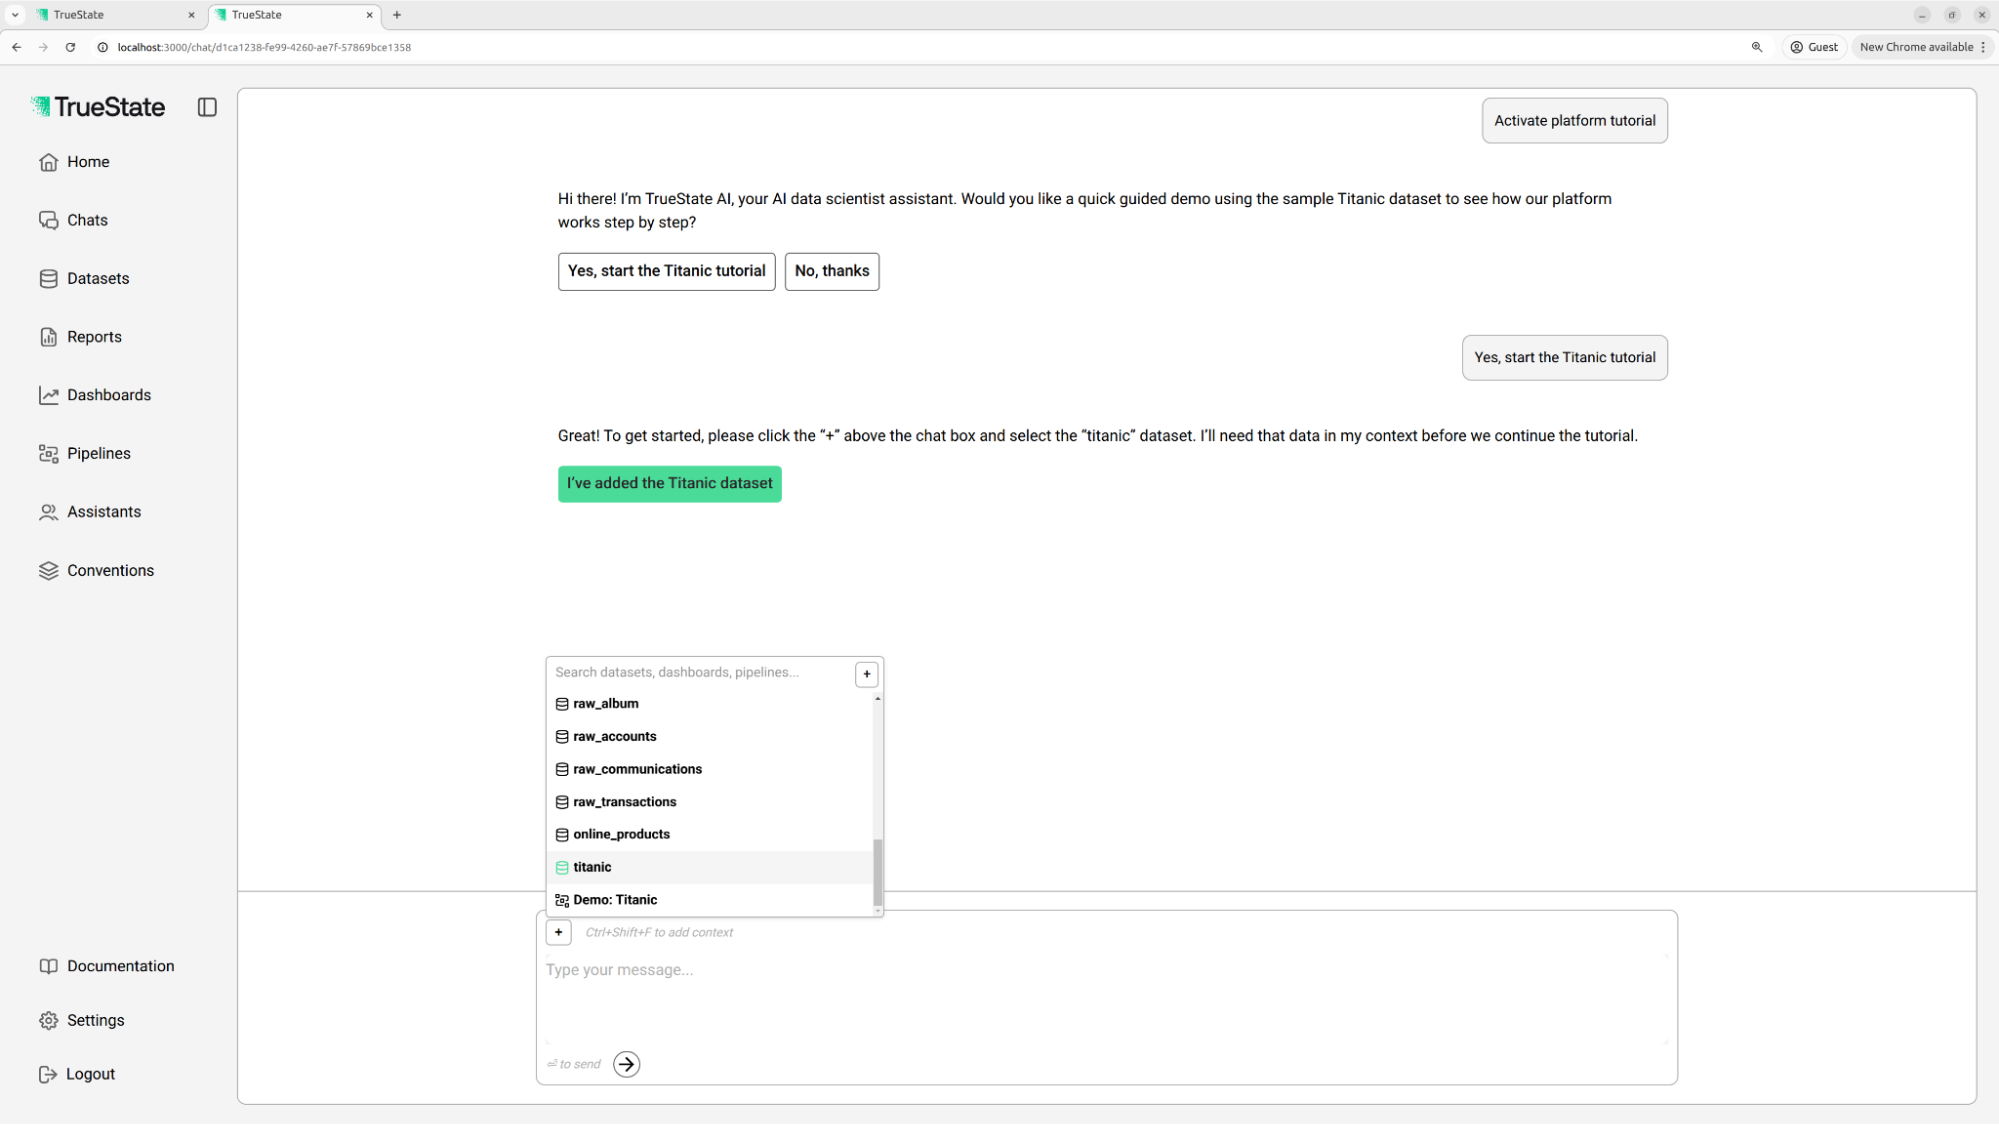
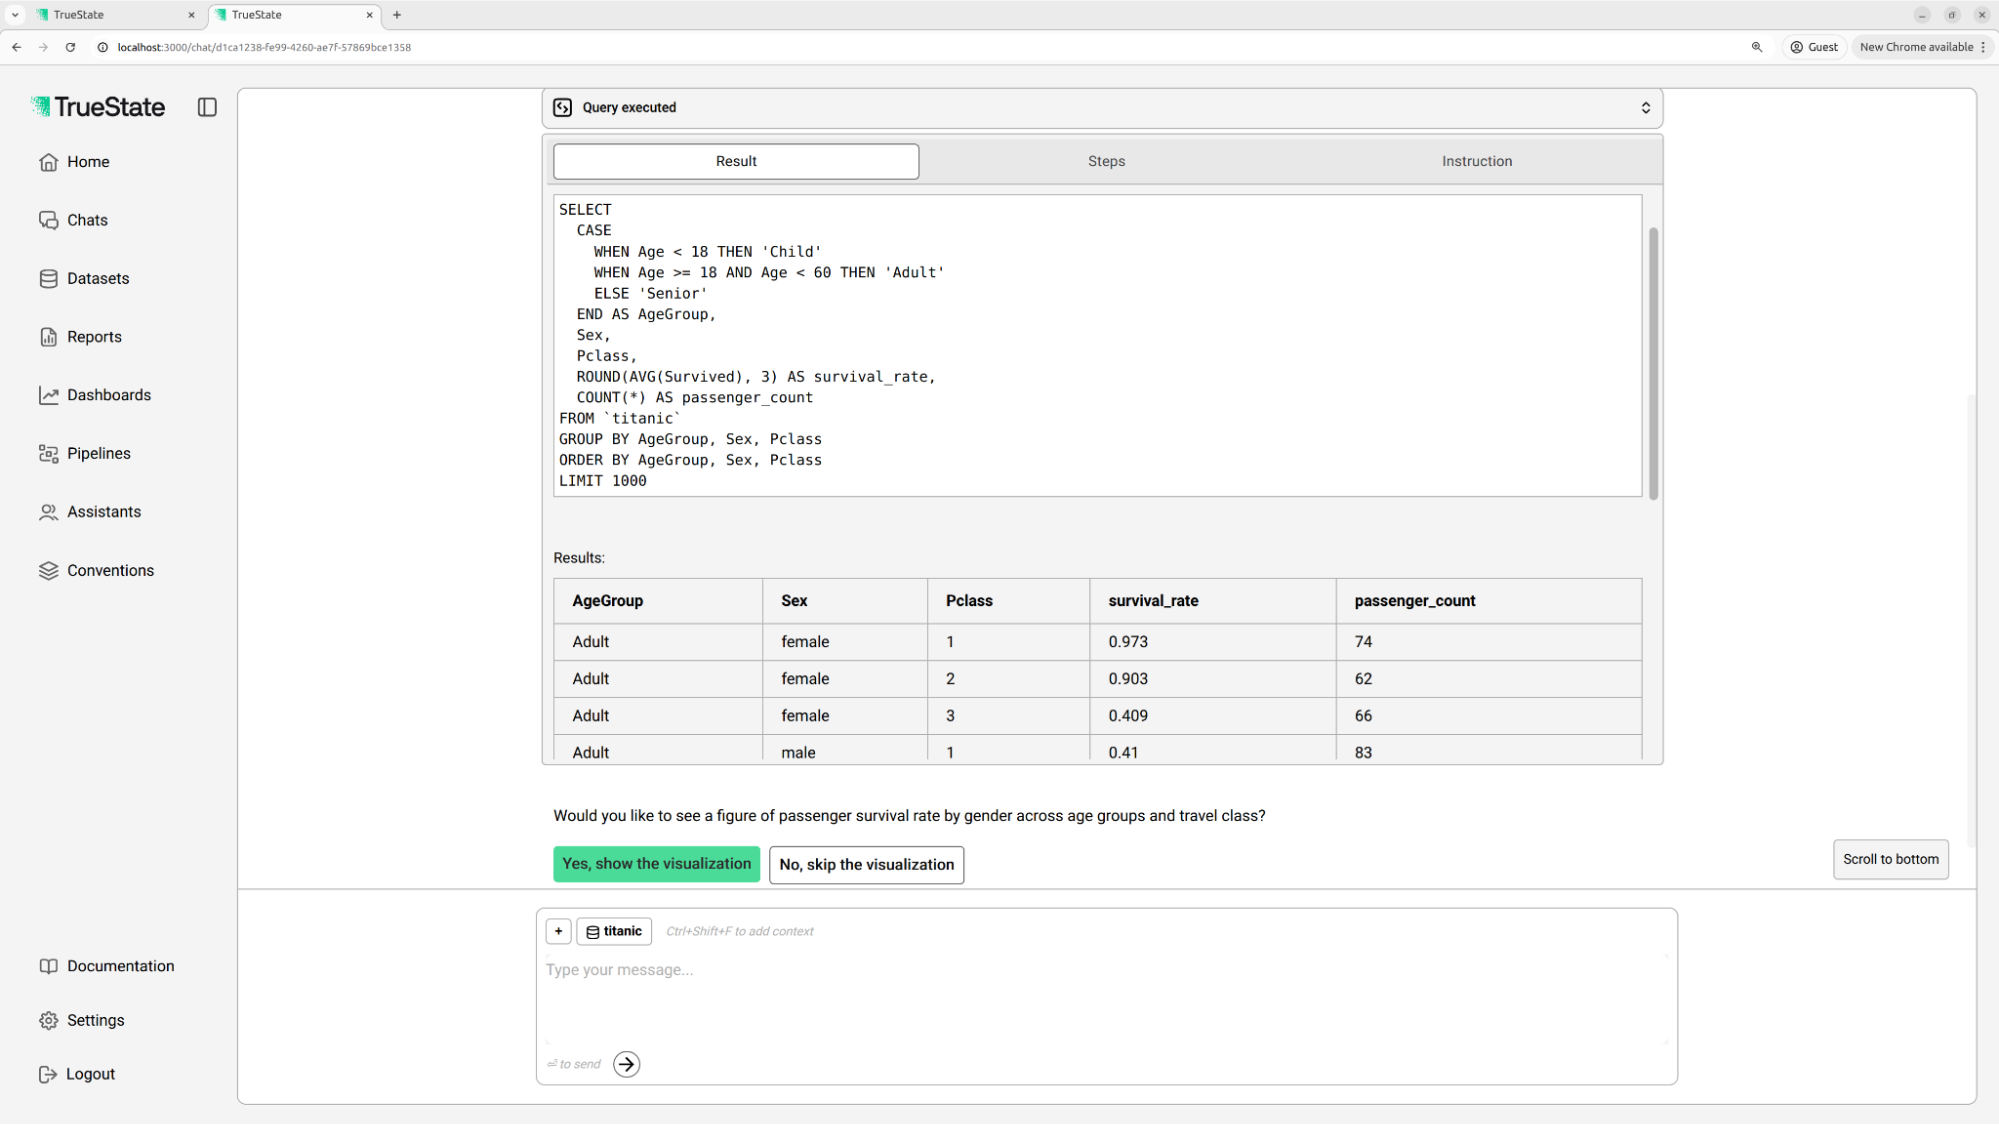
Review the first query results
The chatbot executes a query showing survival rates across passenger groups. Click the ‘Query executed’ card to expand and view details.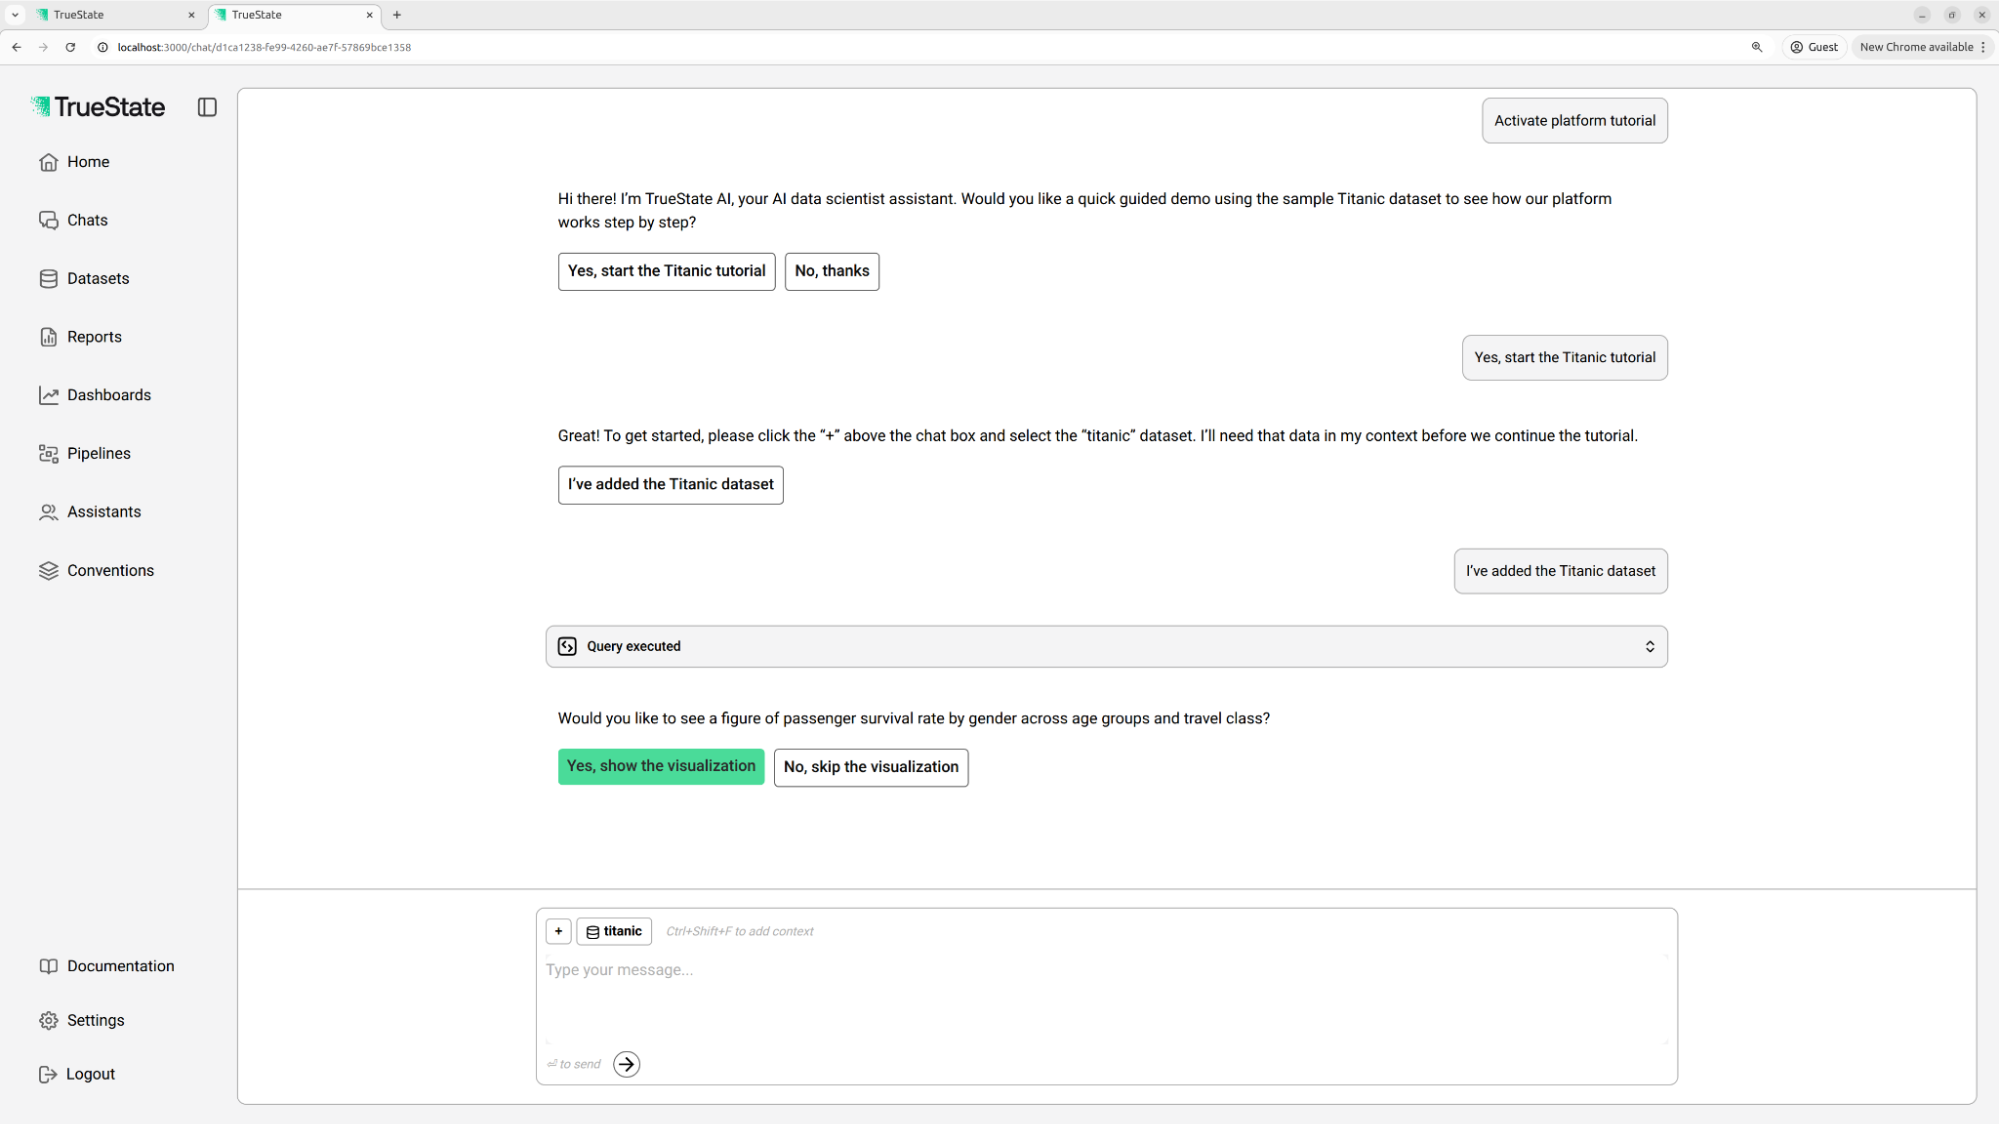
Inspect the survival rate chart
Continue and the bot will present a survival rate chart. Click the result to expand and see the figure.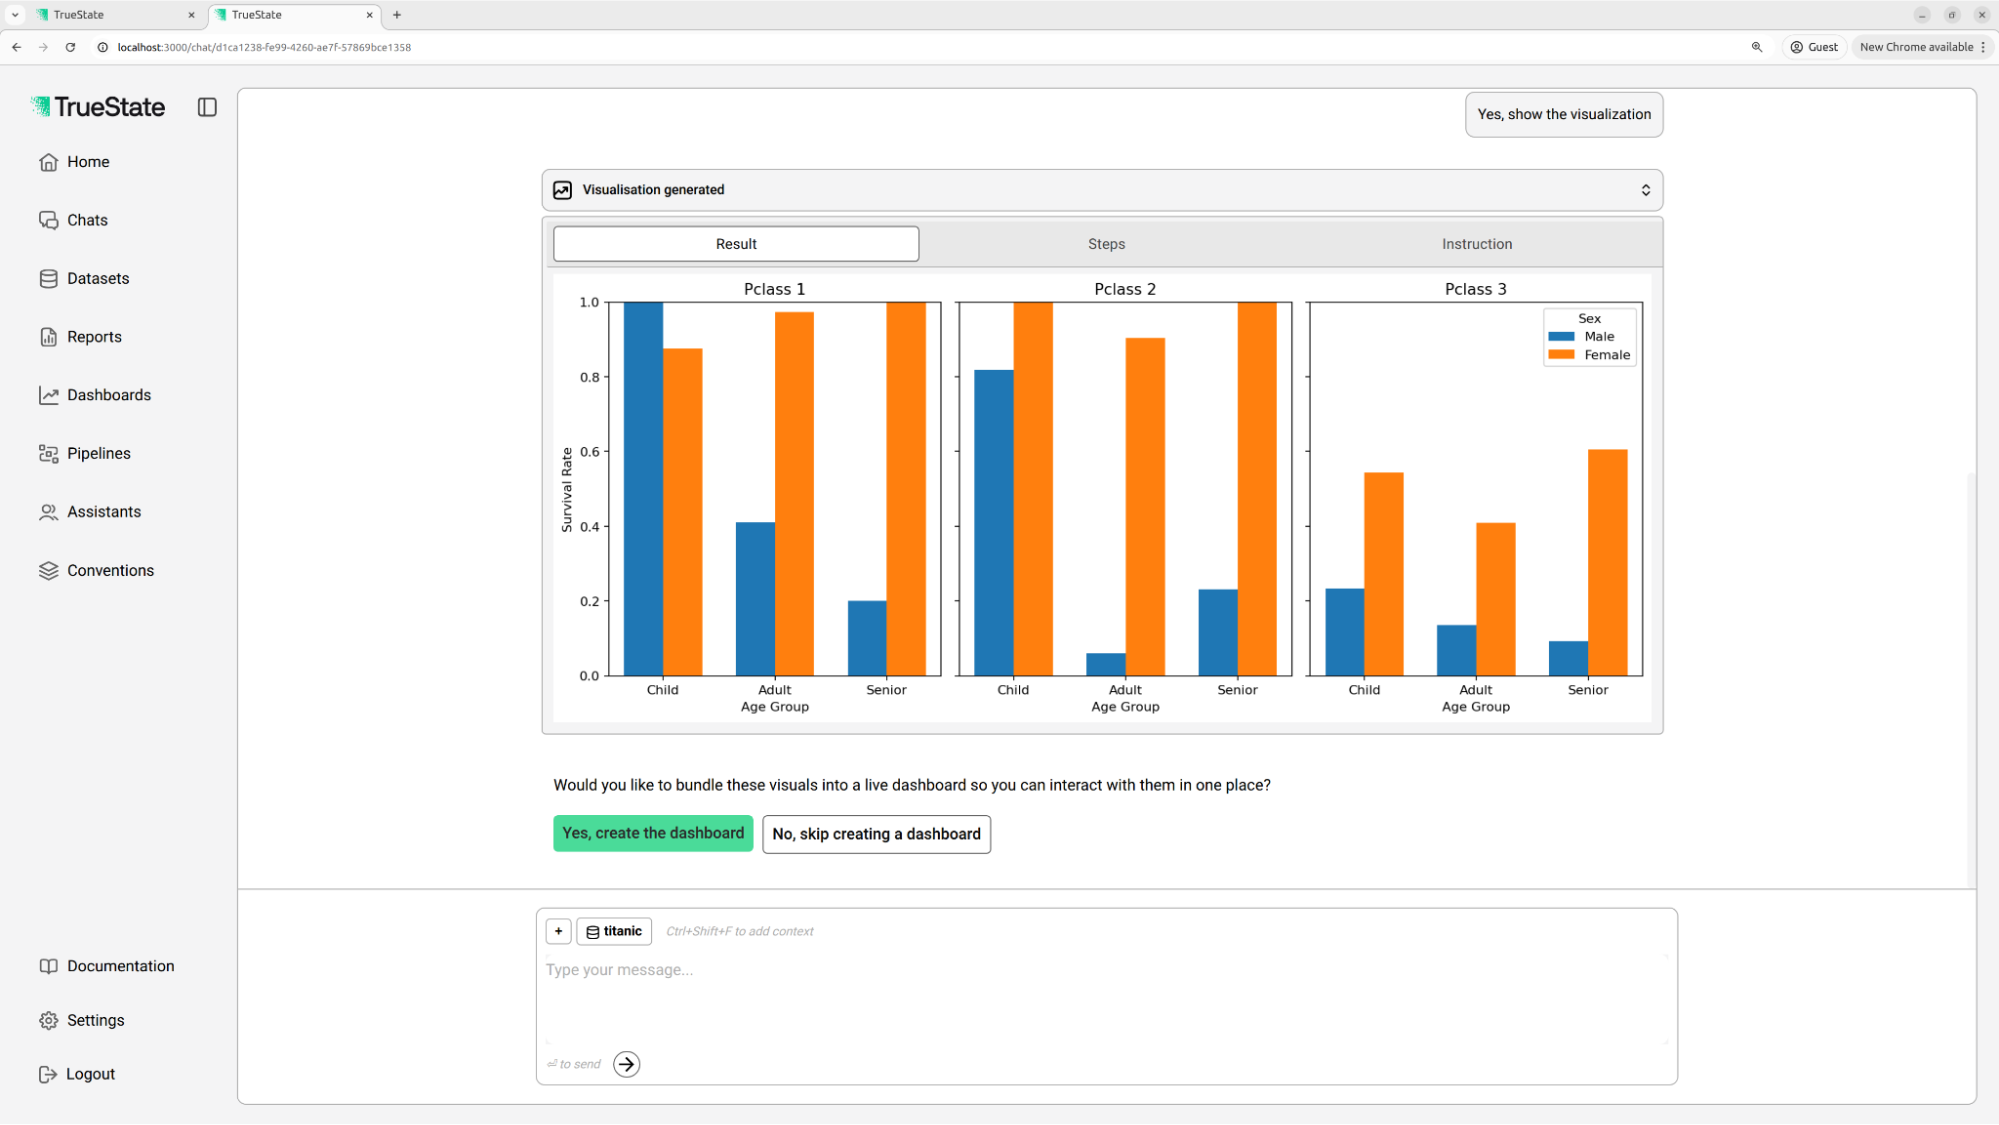
Build a dashboard from the results
The bot offers to create a dashboard of survival rates. Continue to the dashboard to explore an interactive presentation of the data.